Agent software is the platform layer that lets teams design, run, and govern AI-driven workflows without writing custom infrastructure code. In modern business automation, visibility into each decision is essential: when a model call, tool call, or subagent dispatch takes place, teams need clear context to debug, attribute cost, and meet compliance. This article explains what agent software does, why observability matters, how observable systems work step-by-step, who benefits from them, and when to adopt an observability-first agent platform.
What agent software is and why it matters
Agent software combines model orchestration, tool integrations, retrieval, and human-in-the-loop controls so teams can automate repeatable processes like approvals, support routing, and data syncs. Unlike basic automation tools, agent software emphasizes runtime transparency: each run is captured as a span tree so you can see per-step latency, token usage, and cost. That visibility matters because it reduces incident time-to-resolution, clarifies where inference spend accumulates, and supports governance for PII and blocked terms.
- Visibility into every model call and tool call
- Traceability for subagent dispatch and human handoffs
- Cost accounting tied to tokens and latency per step
Expert tip: When choosing agent software, require a live span waterfall so your team can inspect nested subagent activity as it streams.
How observable agent software works — step-by-step
- Build a workflow on a visual canvas: drag agents, model calls, classifiers, tools, and human review nodes. The canvas compiles to an executable flow you can test.
- Execute a run: the platform creates a span tree where each node is a span representing a model call, tool invocation, retrieval, or pause. Spans include latency and token counts.
- Stream the Playground: live activity highlights nodes as runs stream so developers and non-technical users see which step is active and what data moved through it.
- Inspect spans: expand a collapsible span to view prompt snippets, truncated inputs, tool payloads, and the dispatched subagent name.
- Export traces: send OpenTelemetry-compatible traces to your observability stack, or use built-in exports to Langfuse.
This approach turns opaque multi-step agent runs into navigable diagnostics, which accelerates triage and optimization.
Key observability components in agent software
- Span tree with named subagent dispatches and nested child spans
- Token meter per span and per run for granular cost tracking
- Latency breakdowns by span for perf hotspots
- Export hooks to OpenTelemetry or Langfuse-compatible collectors
- Playgrounds that stream state and let you replay runs for debugging
These items combine to make agent engineering measurable and actionable for both SREs and product teams.
Who benefits from observable agent platforms
- Product managers designing flows for customer support and approvals who need to validate behavior
- Agent engineers and ML ops who need traces and token accounting for optimization
- Security and compliance teams who require PII redaction, blocked terms, and audit logs
- Business teams that want to shift manual repeatable processes into automated workflows without heavy developer lift
Agent platform observability closes the feedback loop between production behavior and iterative design.
When to adopt agent software with observability
Adopt when your workflows: scale beyond prototype runs, require multi-step reasoning across models and tools, or need accountability for inference costs and audit trails. If you are integrating third-party tools, exposing agents via web widgets or email, or operating in regulated environments, an observability-first agent platform reduces risk and operational overhead.
How agent software supports governance and cost controls
Agent software that includes guardrails can apply project-level PII redaction, blocked terms, and network allow/deny lists across every agent. Budget and quota caps, versioned entities, scoped API keys, and a centralized audit log make it possible to run many agents while keeping control. Observability data (tokens, latency, cost per span) enables targeted cost optimization and chargeback across teams.
Example: using an observability-first agent platform in practice
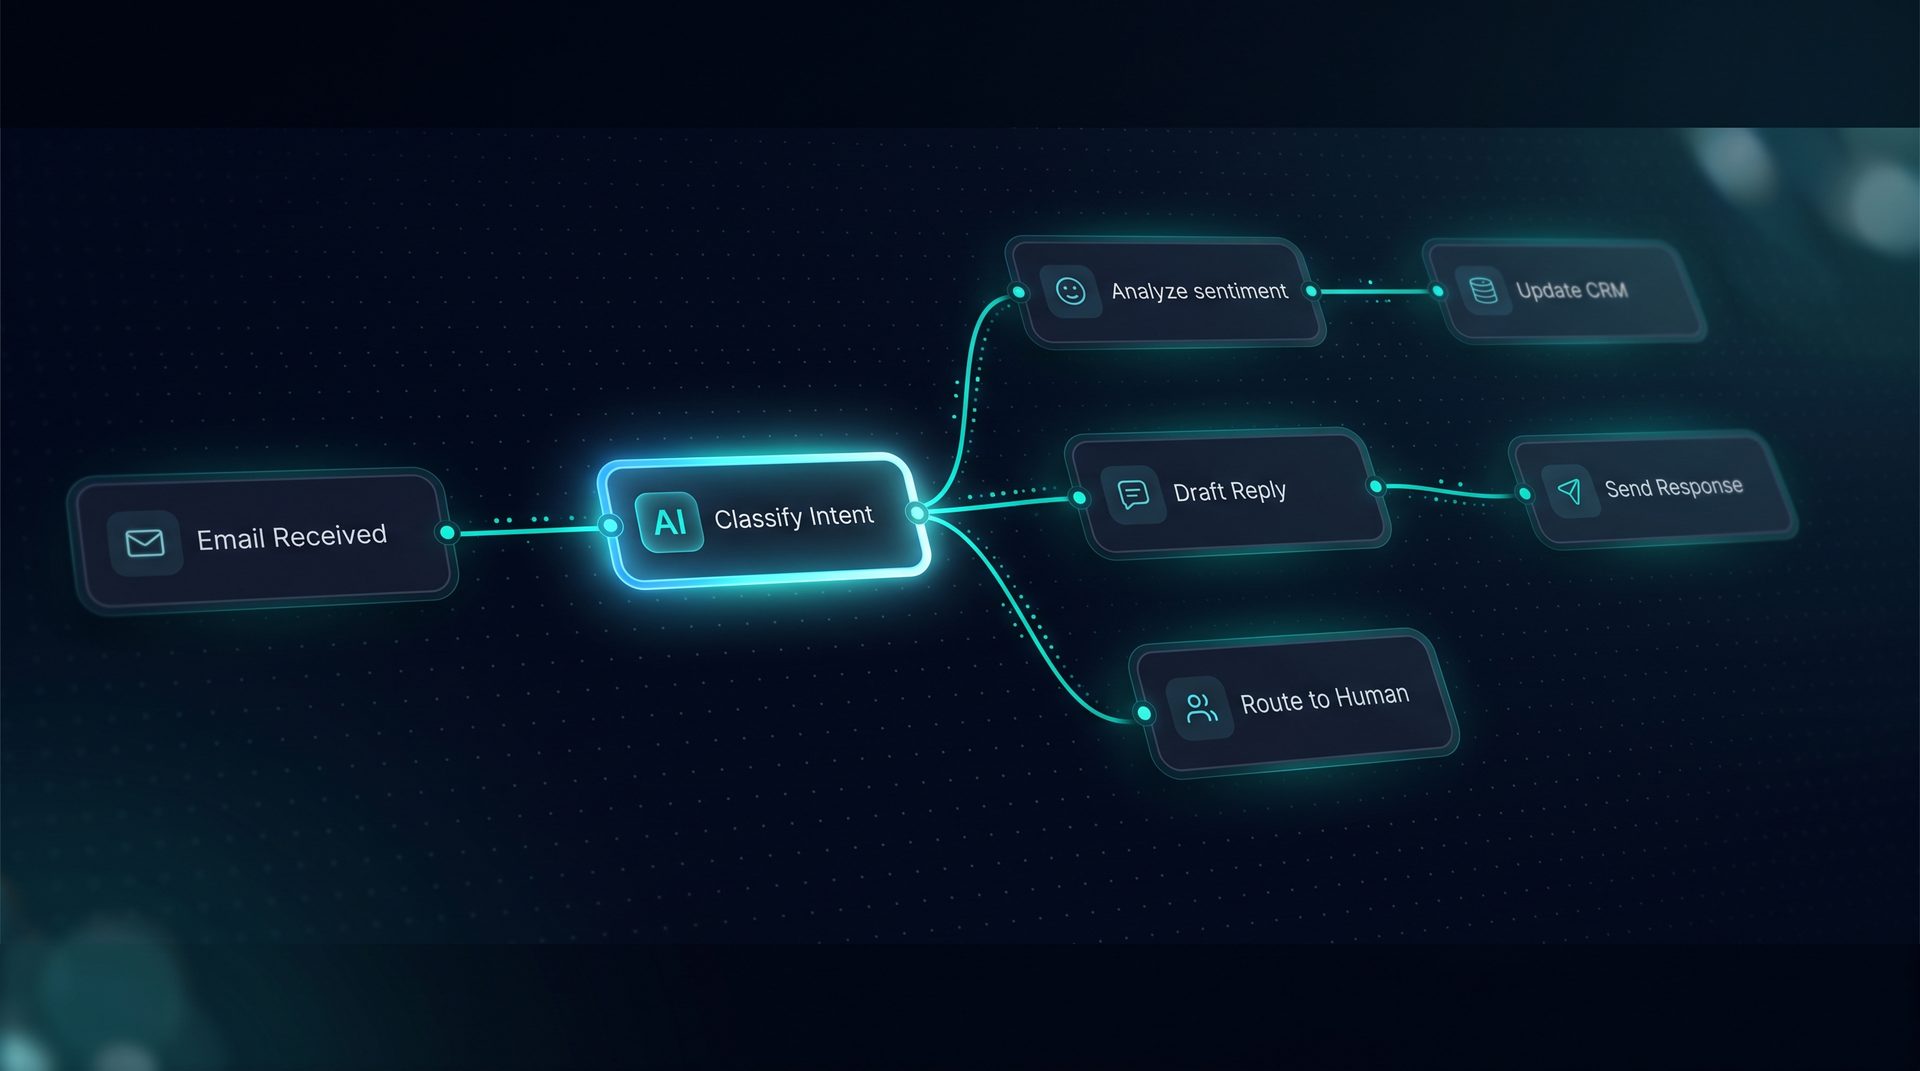
Imagine a customer support workflow that routes emails, uses a retrieval store for docs, enriches with a ticketing tool, and pauses for human approval on sensitive requests. With observable agent software you:
- See exactly which retrieval chunks matched and why via a search debugger
- Inspect the tool call payloads and response latencies when contacting a ticketing API
- Track token usage on the model calls responsible for summarization
- Export traces to your OpenTelemetry collector for cross-system correlation
This level of detail transforms guesswork into data-driven iterates for agent automation.
Why DeepForce is a natural example (not a hard sell)
DeepForce exemplifies an agent software approach that builds on LangChain and LangGraph, offering a drag-and-drop canvas, live Playground, span-level span trees, and OpenTelemetry exports. It demonstrates how an agent platform can combine visual agent builder, workflow canvas, tool registration, retrieval and RAG, human-in-the-loop controls, and observability without requiring external orchestration services. Use this as a reference when evaluating agent platforms.
Next steps for teams evaluating agent software
- Map key workflows and identify observability gaps you need to fill
- Require per-span token and latency metrics in demos
- Validate export compatibility with your observability stack
- Test a live run that includes model calls, tool calls, and a human pause to see span granularity
Agent software with strong observability makes agent engineering repeatable and governable, turning complex multi-step AI workflows into auditable, optimizable systems.